
Analyze Scientific Data Using Python and LabPlot
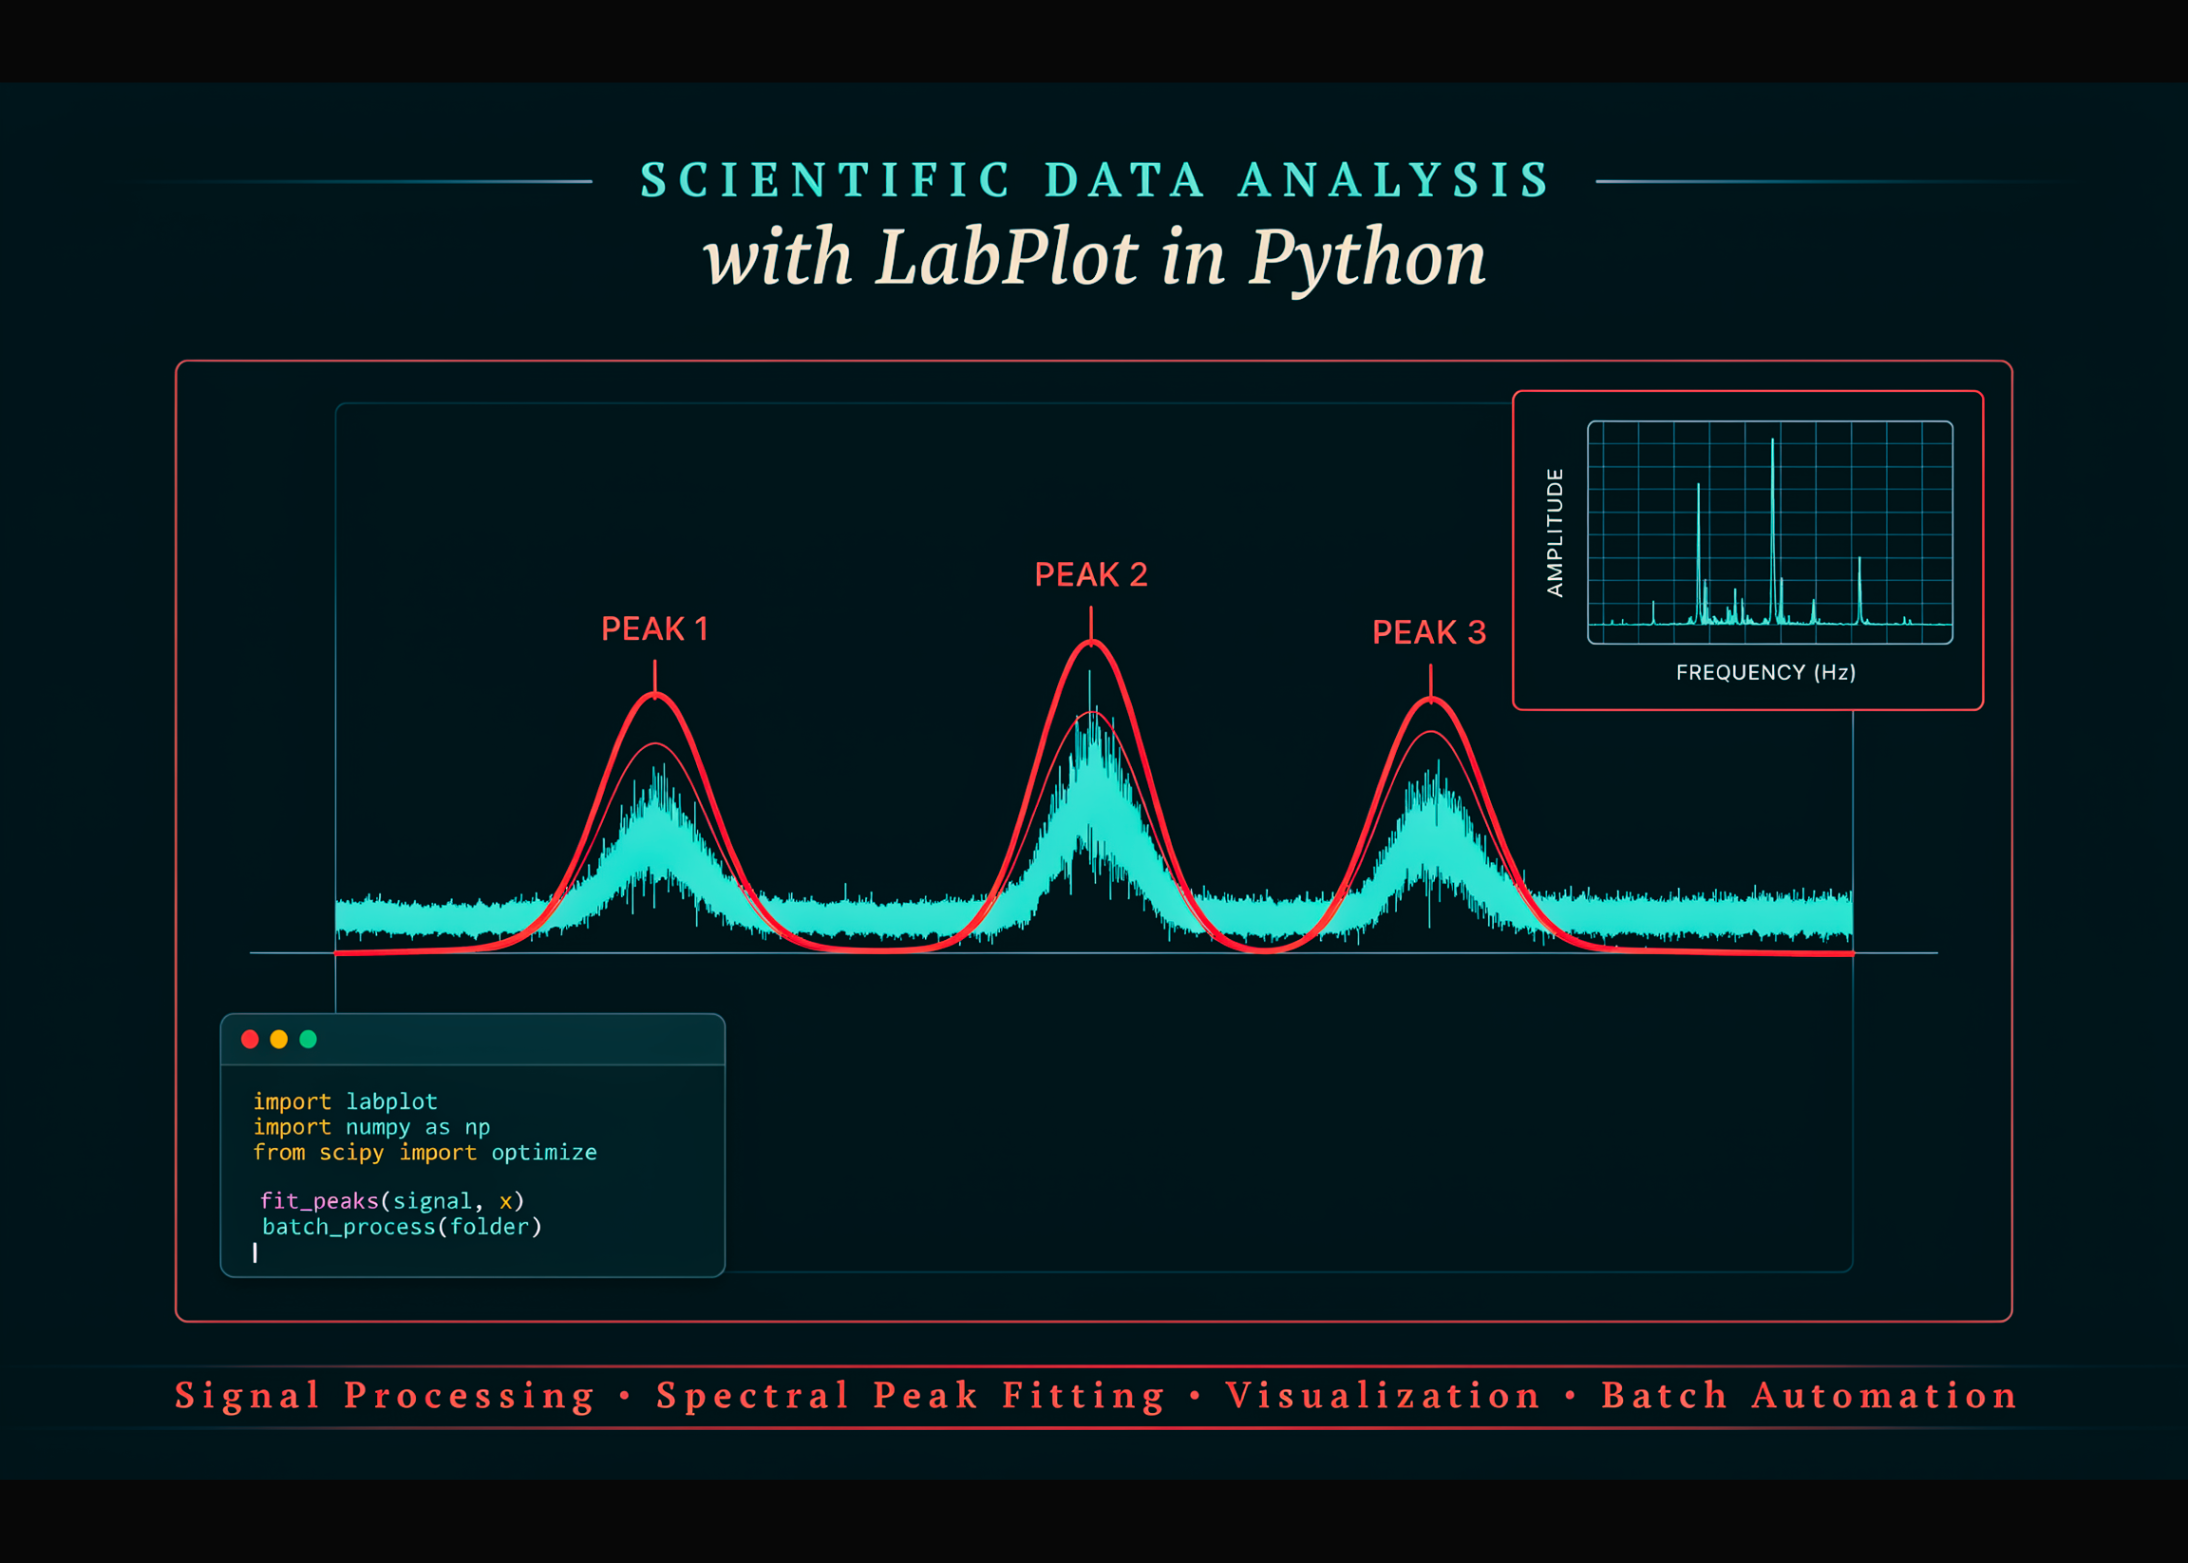
You can now use Python to handle scientific data tasks like those found in LabPlot. This guide shows you how to structure your work using similar methods for analyzing and plotting data.
We cover the basics of importing data and running statistics. You will also learn how to smooth signals, perform Fourier analysis, and find peaks in your data sets.
These components are built to be reusable for your future projects. By following this approach, you can automate your work and manage your scientific datasets more effectively.
Comments (0)
No comments yet. Be the first!
More AI news
 News
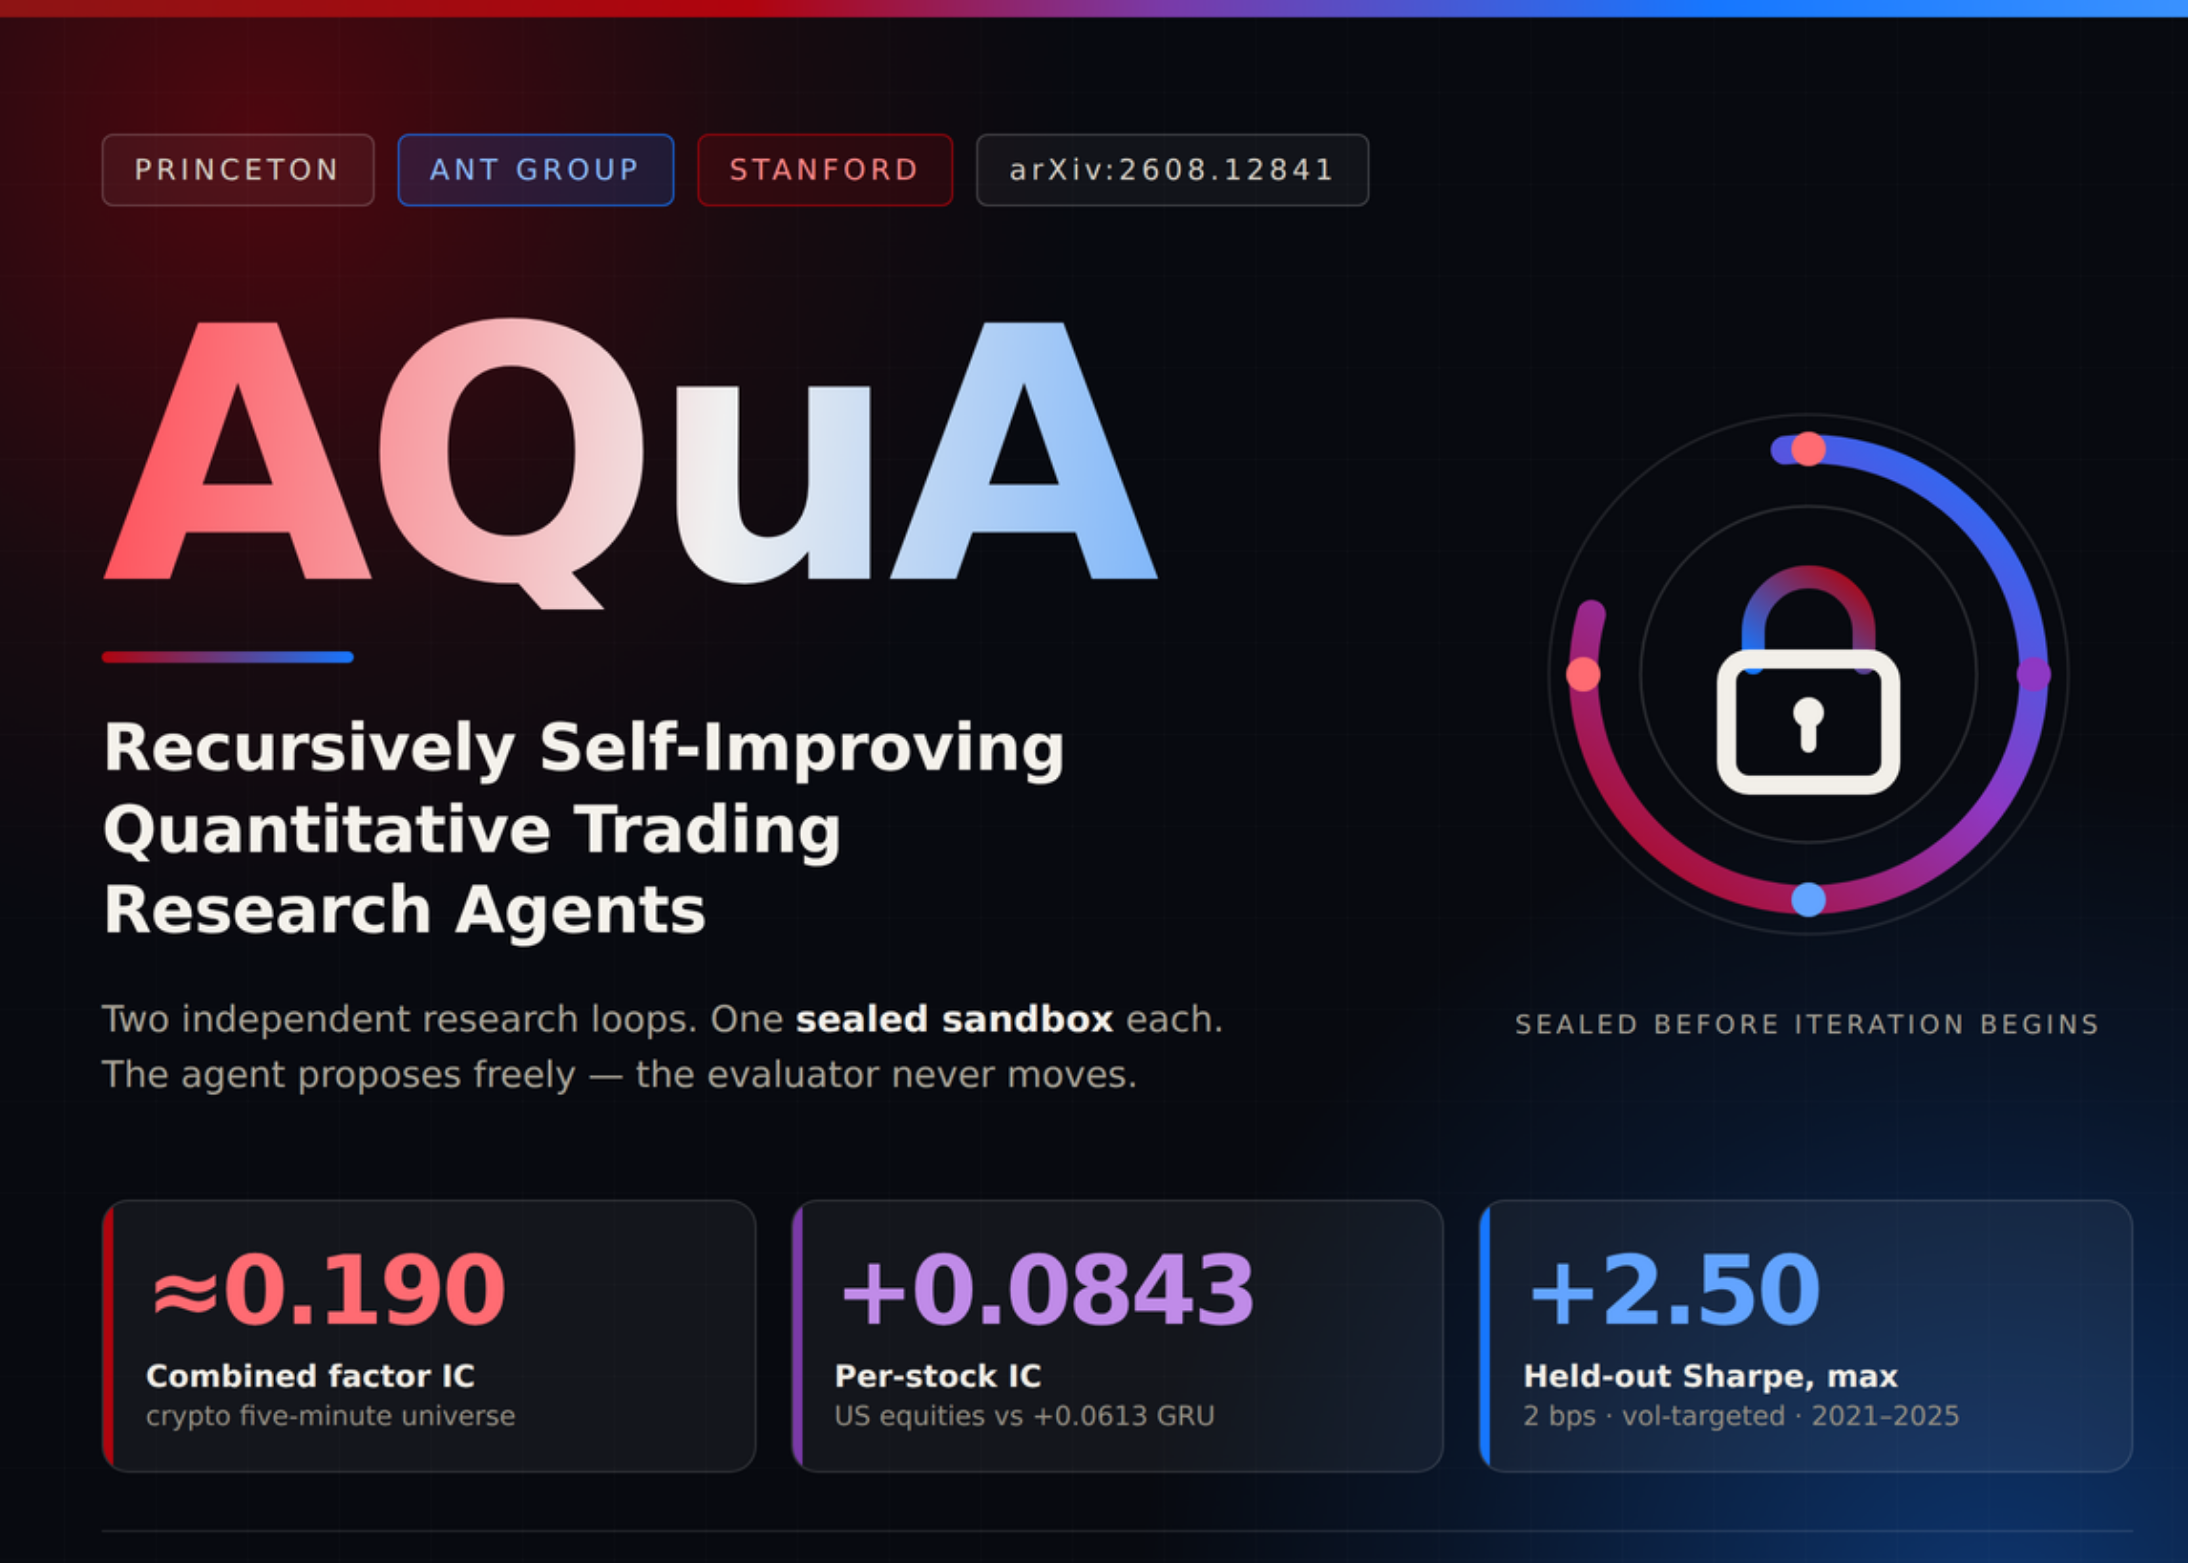
NewsNew AI Tool Fixes Mistakes in Financial Research
Researchers developed a new framework to stop AI from learning from its own bad data in financial trading models.
 News
NewsPerplexity adds local AI to Mac apps
The new update lets your Mac handle some AI tasks directly on your computer.
 News
NewsMeta Releases Muse Image Model on Fal
Meta has launched a new AI model on the Fal platform that plans and edits images on its own.