
Build Fast Interactive Charts with Reflex XY

Reflex XY is a new Python tool for building interactive charts. It handles massive datasets with millions of points without slowing down your computer. You can use it to build complex displays that stay fast and responsive.
The library supports real time data streaming and custom design elements. You can add your own plugins to make specific marks or shapes. This gives you full control over how your data looks on the screen.
You can also export your work into formats ready for professional use. Whether you need a quick sketch or a final figure for a report, this tool covers it. It is a great option for anyone working with large data sets.
Comments (0)
No comments yet. Be the first!
More AI news
 News
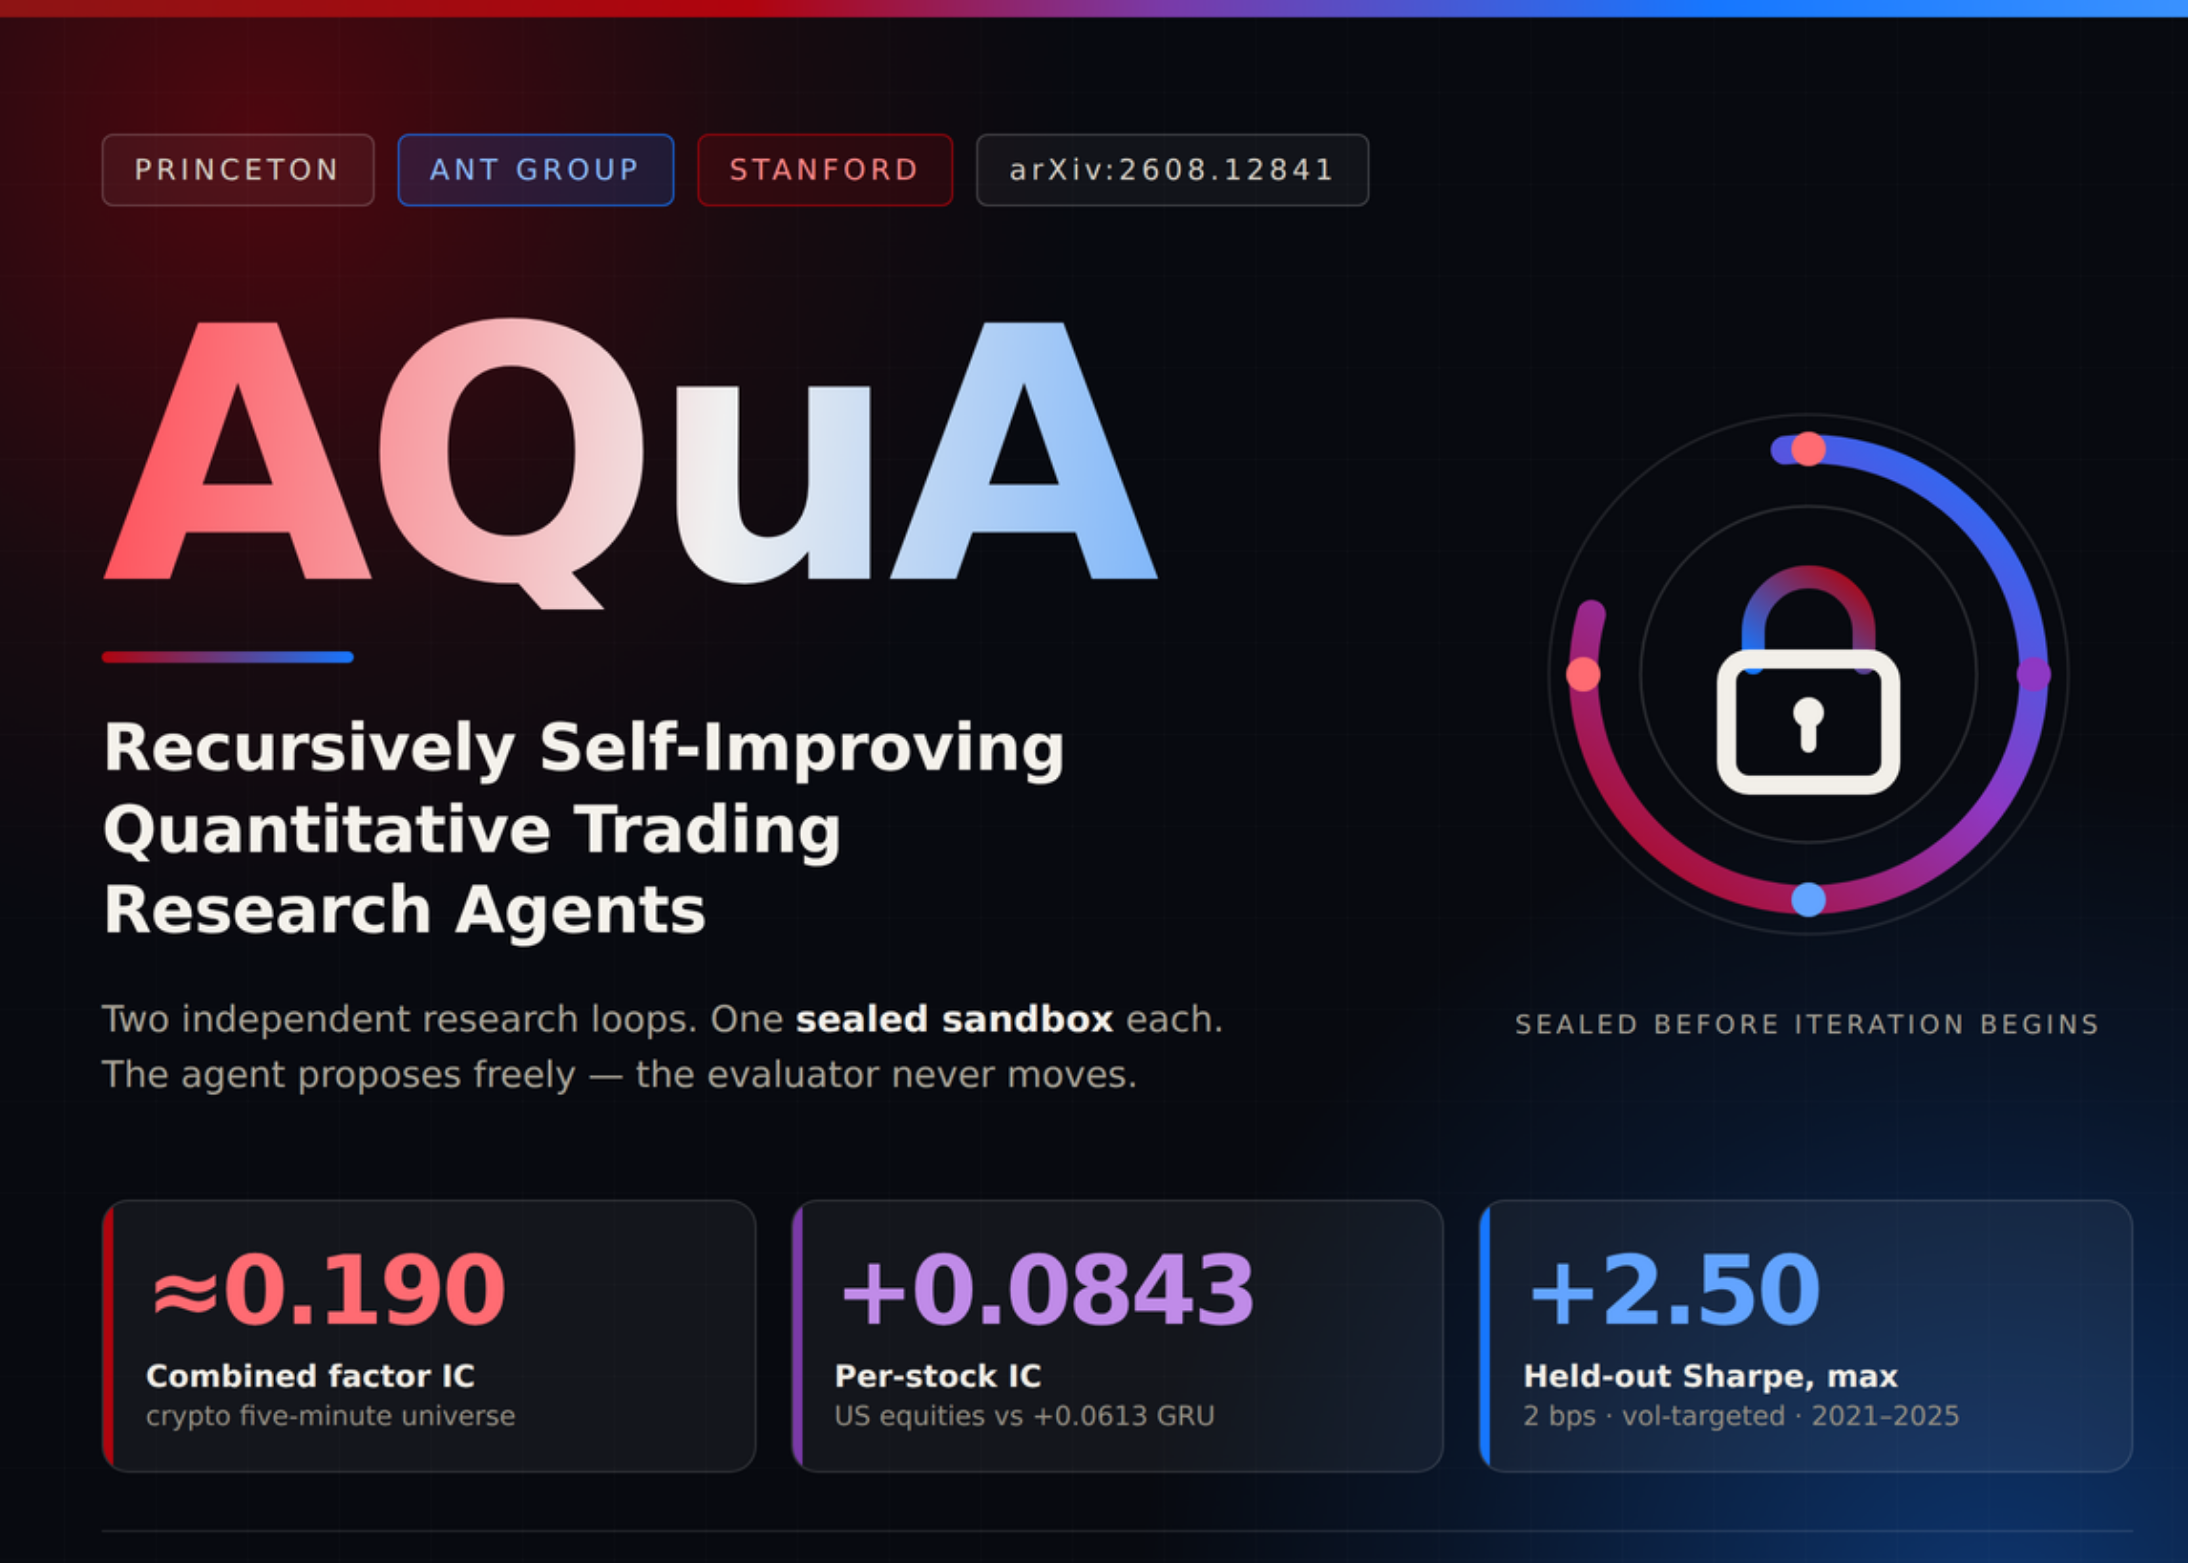
NewsNew AI Tool Fixes Mistakes in Financial Research
Researchers developed a new framework to stop AI from learning from its own bad data in financial trading models.
 News
NewsPerplexity adds local AI to Mac apps
The new update lets your Mac handle some AI tasks directly on your computer.
 News
NewsMeta Releases Muse Image Model on Fal
Meta has launched a new AI model on the Fal platform that plans and edits images on its own.